Northeast Colorado Flood - 9-15 September 2013
From 9 to 15 September 2013 record setting heavy rain fell over much of northeastern Colorado.
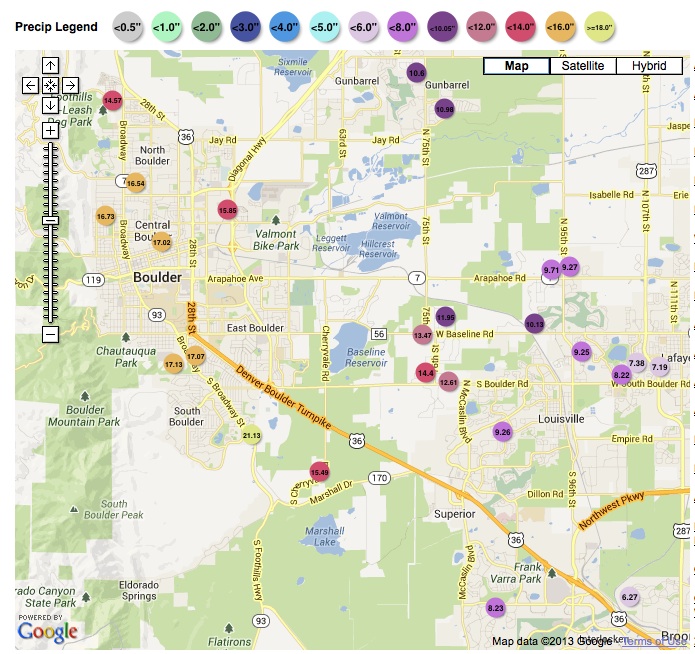
Boulder storm total precipitation
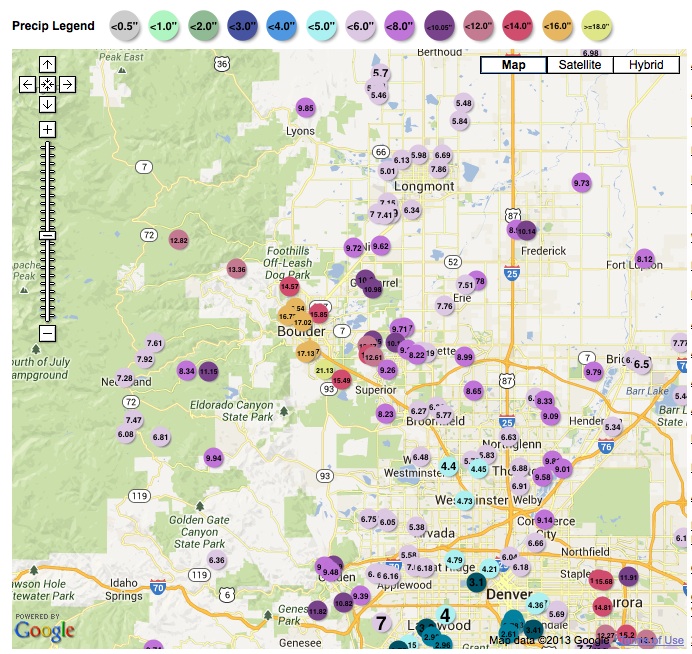
Denver metro storm total precipitation
For Boulder, CO the following records were set during this event:
Daily precipitation records:
10 Sept: 1.02 inches
11 Sept: 1.92 inches
12 Sept: 9.08 inches (all time daily precipitation record)
13 Sept: 2.44 inches
15 Sept: 1.94 inches
The 9.08 inches of precipitation on 12 Sept broke the previous daily precipitation record of 4.80 inches set on 31 July 1919.
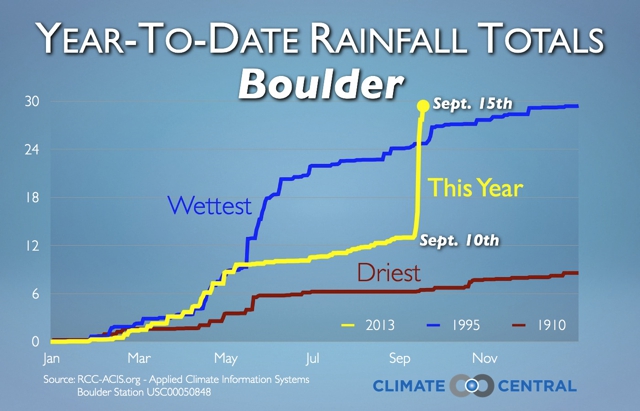
As of 16 September the monthly precipitation in Boulder was 17.17 inches. This set a new record for monthly precipitation in Boulder, breaking both the previous September record (5.50 inches in September 1940) and the previous all-time monthly record (9.59 inches in May 1995). Normal September precipitation in Boulder is 1.84 inches.
As of 16 September the annual precipitation in Boulder was 30.13 inches. This set a new annual precipitation record, breaking the previous annual record of 29.43 inches set in 1995. Normal (for the period 1971-2000) annual precipitation in Boulder is 20.23 inches.
Local precipitation observations
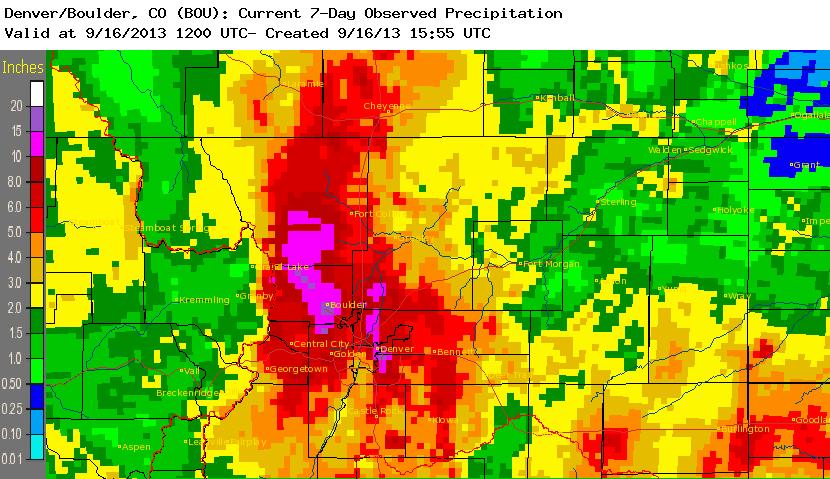
Northeast Colorado precipitation estimates (storm total / daily animation)
CoCoRAHS Boulder county precipitation (animation)
CoCoRAHS Denver metro precipitation (animation)
From 9 to 15 September 17.13 inches of rain fell in Boulder.
Weather stations around Boulder maintained by the Department of Atmospheric and Oceanic Sciences measured the following rainfall amounts during this 6 day period:
University of Colorado campus: 13.73 inches
Louisville, CO: 8.56 inches
Lafayette, CO: 6.57 inches
During this time period Denver International airport measured 4.65 inches of rain.
Weather maps
Surface fronts / radar (animation)
Surface observations (animation)
850 mb (animation)
700 mb (animation)
500 mb (animation)
300 mb (animation)
Satellite images
IR satellite images (animation)
Water vapor satellite images (animation)
Model analyses
GFS SLP / 1000-500 mb thickness (animation)
700 mb height / RH (animation)
500 mb height / vorticity (animation)
300 mb height / wind speed (animation)
Additional Links